DoorDash Stock Forecast: Will DASH Price Hit $150 Level?

DoorDash price forecast indicates a mild correction in the price it misses its earning forecast. However, the price is still trading above the important exponential moving averages showing the stock price is still in the bullish zone.
Looking at the performance of the stock this week it faced a mild correction of 5.27%. However, the stock in the long term performs well as in the last 3 months it grew by 18.94%, and in the last 6 months, it grew by 47.78%. Over the year the stock grows by almost 88% as per the data of Tradingview shows the investor’s confidence in the stock.
DoorDash fails to meet its earnings expectations for the first time a year despite growing its revenue and customers. However, the company needs help to make profits because of easy market entry, labour regulations, and fierce rivals in the food delivery sector. Analysts back Dash’s valuation, but its financial results and weak differentiation worry investors about its future profitability.
DoorDash, Inc. is a company from San Francisco that runs a platform for ordering and delivering food online. It has the ticker DASH. DoorDash is the biggest food delivery company in the US, with 56% of the market. It also has 60% of the market for convenience delivery.
DoorDash Stock Forecast: What The Next Move of DASH Price
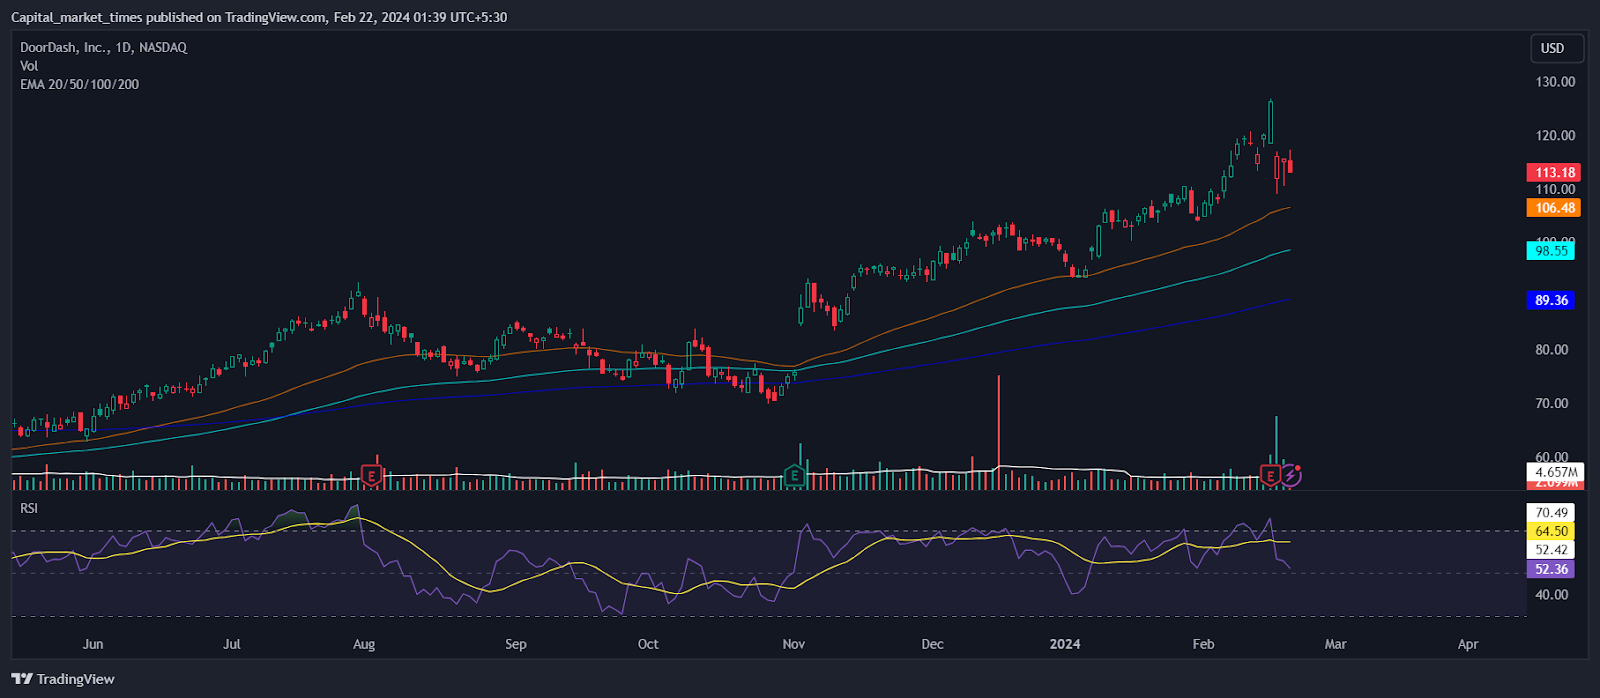
Source: Tradingview
On the technical charts, the price needs to maintain the support of the $100 level to continue the uptrend. The next target for the bulls is the $150 level, which is a key psychological barrier and a major supply zone. On the downside, the support is the $100 level.
Exponential Moving Averages (EMA): The DoorDash stock price is currently trading beyond the important exponential moving averages, including the 50-day, and 100-day.This alignment suggests bullish sentiment on the daily technical chart.
Relative Strength Index (RSI): The RSI curve stands at 52.41, positioned below the 14-day Simple Moving Average (SMA) curve. This placement suggests that the price is facing mild bearishness.
Moving Average Convergence Divergence (MACD): The MACD is also signalling mild correction in the stock, hovering in the positive zone with a bearish crossover and a single red bar on the histogram.
Conclusion
DoorDash stock forecast is mixed, as the price is showing both bullish and bearish signals on different time frames. The price is trading above the key EMA levels and has grown significantly in the past year, indicating strong demand and confidence in the stock. However, the price is also facing a mild correction and some resistance levels, indicating a possible pullback or consolidation in the near term.
Disclaimer
It’s important to note that the views and opinions presented in this article are for informational purposes only and do not constitute financial, investment, or other advice. Investing in or trading stocks carries inherent risks, and readers should conduct their research before making any financial decisions.