AAOI Stock Price Has Slipped Below Key Moving Averages; Is Bullish Trend Ended?

- The Applied Optoelectronics stock price is losing momentum ahead of earnings.
- The AAOI stock price has lost 17.36% in the past 10 days.
AAOI stock price has been in a bullish trend since May 2023 and gained approximately 1300% till the end of 2023. In December 2023, the bullish trend was interrupted near the $24 hurdle and reacted negatively. In mid-February, the buyers attempted to overcome the last swing high but sellers were strong enough and dragged down the price below the key moving averages.
The asset price was gaining bullish momentum by defending the last swing low but the price has failed to form a higher low. For the last few weeks, the AAOI stock price has been losing momentum by forming lower lows and lower highs.
The price is trading below the key moving averages which showcases the seller’s dominance. ADX is at 14 which is recovering from the selling zone indicating the involvement of buyers. According to the MACD, the histogram is converting to red and the MACD and the Signal lines are below the Zero line showing the sellers’ strength.
AAOI Crypto Price Forecast; Will It Defend the $10 Mark?
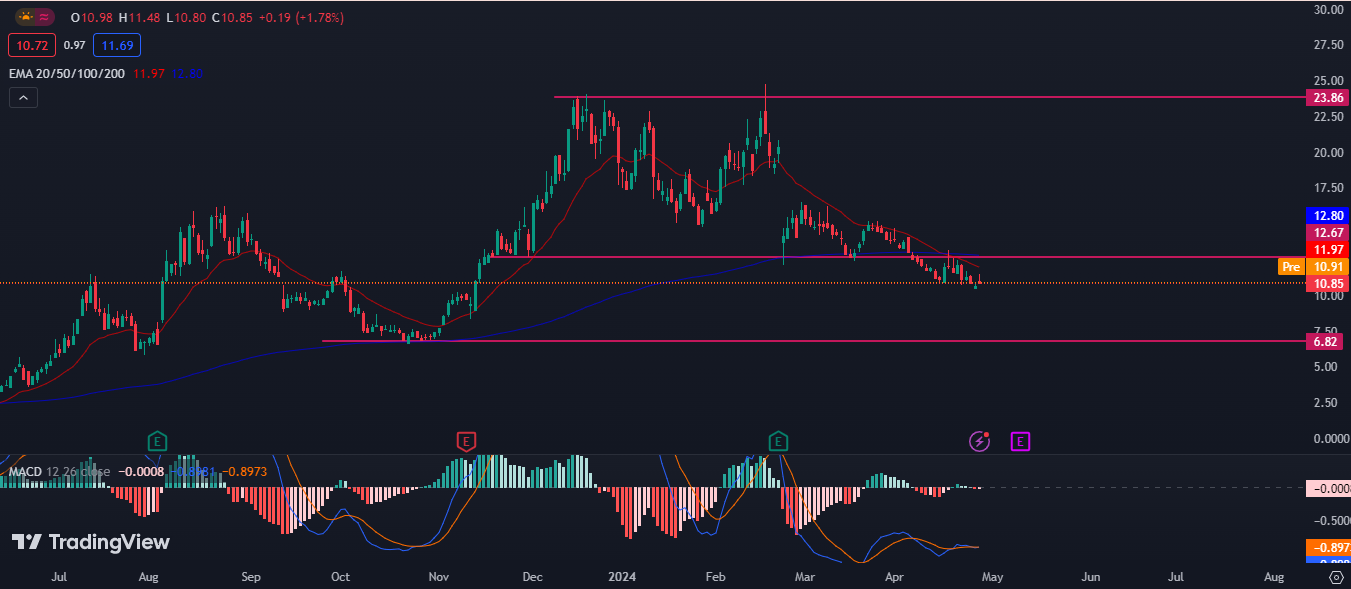
BINANCE: AAOI/USD 1-Day Chart By TradingView
The chart structure displays the bearish momentum since the beginning of 2024. The price has slipped below the 200-day EMA and recorded a multi-day low today.
Suppose the chart structure manages to invite the sellers then the price may keep falling by forming lower lows and lower highs. If the price fails to defend the last swing low of $7 then a bearish trend for the long term can be initiated.
On the other hand, if the stock price manages to surpass the key moving averages with elevation in trading volume then it may follow the bullish trend and eye for a new swing high.
Technical Analysis of AAOI Stock on Weekly Timeframe
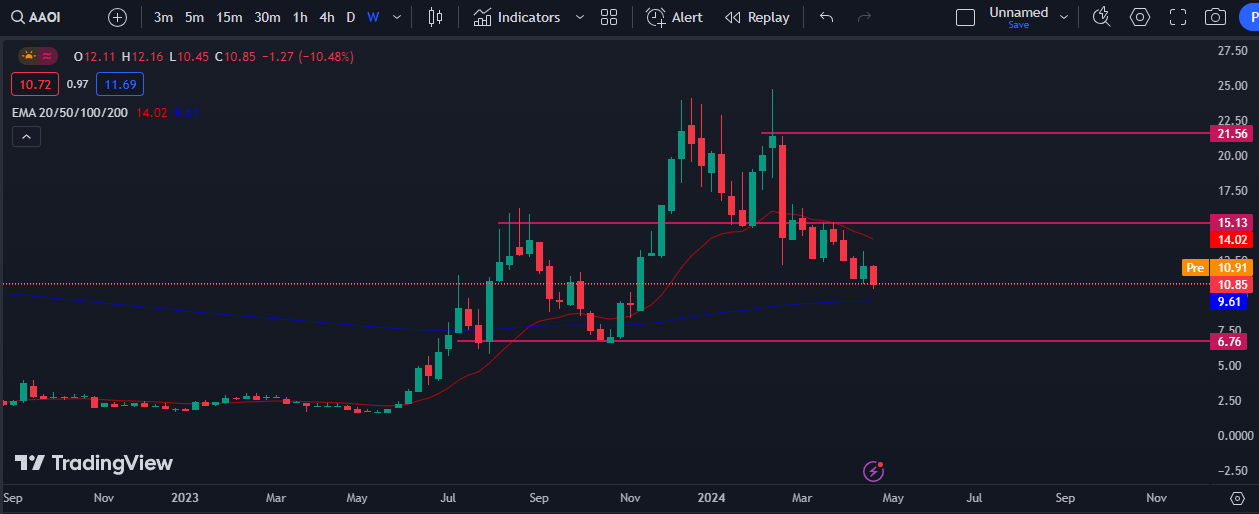
BINANCE: AAOI/USD 1-Week Chart By TradingView
On a weekly time frame, the AAOI stock price has been struggling between the 20-day and 200-day exponential moving average. Sellers have been in control and the price is heading toward the 200-say EMA.
If the price falls and takes support on the 200-day EMA and surpasses the 20-day EMA, buying momentum can be generated and buyers may look for a new high. If the investors show interest then the bullish trend may lost for the next few months.
Alternatively, if the AAOI stock price falls below the 200-day EMA, the price may easily drop to the major support level of $7. Below the $7 level, it will be difficult for the buyers to bounce back.
Resistance Levels for the Applied Optoelectronics stocks are $15.00 & $24.00 and Support levels for the stock is $11.50 & $6.80.
Disclaimer
It’s important to note that the views and opinions presented in this article are for informational purposes only and do not constitute financial, investment, or other advice. Investing in or trading stocks carries inherent risks, and readers should conduct their research before making any financial decisions.