BNB Price Prediction AUG-23: How Long Can BNB Go After Breakout?

BNB is a crypto coin that belongs to the Binance exchange and has the BNB symbol. It started as an Ethereum-based token but now runs on Binance’s own blockchain, the Binance chain. Crypto mainly serves as a payment method for transaction and trading fees on the Binance exchange
According to CoinMarketCap the current market cap for crypto is $36.9B. The derivatives data show a +69.36% spike in trading volume and a +68.38% spike in options volume. This suggests the gaining interest and popularity of BNB crypto among the trader’s community.
The long/short ratio for the crypto is 0.9298 with long liquidation of $619.94K against short liquidation of $123.62K. The all-time high for the coin is $686.31 and the crypto is currently trading at -64.97% down from the all-time high and is consolidating in a range.
BNB Price Technical Analysis
CMT by shubhamsm006 on TradingView.com
BNB is in a bearish trend, but it has broken above the 50-day and the 200-day Simple Moving Average. If the momentum continues on the upside, we could see a golden crossover soon, which can trigger a new bullish trend in the market.
The RSI for crypto looks weak on the charts, as it is trading below the 50 level and staying below it. If it fails to rise above this level, the price may slide downward in the coming days.
Volume Analysis for BNB
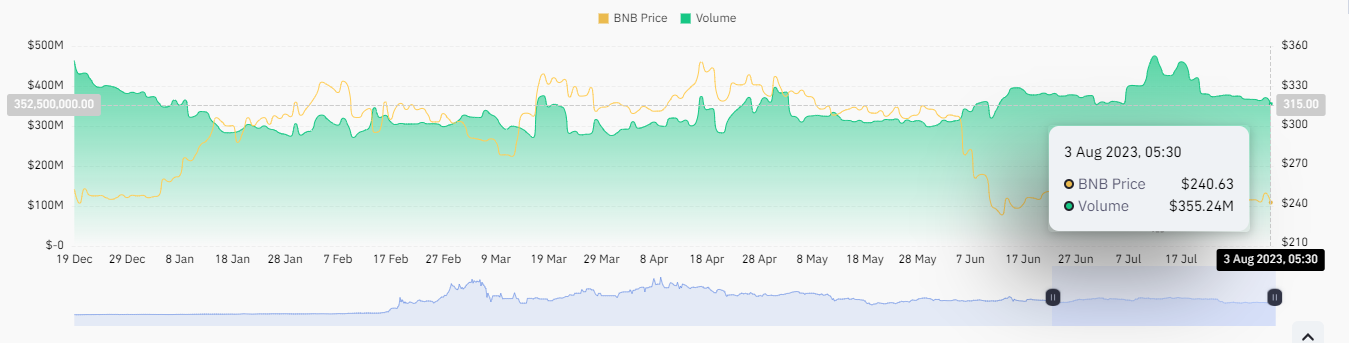
Source: Coinglass
BNB has seen a significant increase in its volume. The derivatives data and the chart indicate a high volume spike that can lead to strong momentum on either side of the zone’s breakout.
Conclusion
The BNB crypto price is trading within a range-bound area, resulting in a flat trend. The SMA is in a death cross due to a consistent decline of the price in the market. The RSI for the coin is also negative, which indicates weakness in the market. However, the volume shows a good amount of activity in the coin.
Therefore, we should wait for the breakout in either direction, which will determine the further direction of the market.
Technical Levels:
- The support level is $230.00.
- The resistance level are $316.00 and $340.00.
Disclaimer
The evaluation provided in this article is for informational and educational purposes only. Do not rely on this information as financial, investment, or trading advice. Investing and trading in crypto involves risk. Please assess your situation and risk tolerance before making any investment decisions