DYDX Price Surge After it Overtake Uniswap In the Daily Transactions Volumes
DYDX is making buzz in the market by surpassing the uniswap in the daily transaction volume smashing the $757 million mark. However, this accomplishment is essential for the DYDX as it shifted from the Ethereum blockchain to the Cosmos ecosystem last year.
Decentralized exchange (DEX) dYdX’s decision to migrate from the Ethereum-based layer-2 network to its stand-alone blockchain within the Cosmos ecosystem is part of its V4 upgrade and it was taken to increase the trading flow and optimize the network.
The decision turned out to be successful as DYDX surpassed Uniswap in Daily transaction volumes and achieved a milestone of smashing $757 million in comparison to Uniswap’s $608 million as per the data of coinmarketcap.
Moreover, the DEX’s V3 market on the Ethereum blockchain is still working and noticed a $567 million marking the 3rd position. DYdX reports that its v4 market has traded $17.8 billion since it started. In 2023, its v3 market had more than $1 trillion in trades, with some days going over $2 billion.
DYDX Price Technical Analysis on the Daily Chart
DYDX price is trading in the descending parallel channel and is currently about to break the upper resistance level. However, the faith of the price will be decided by whether it sustains beyond the current price range or not.
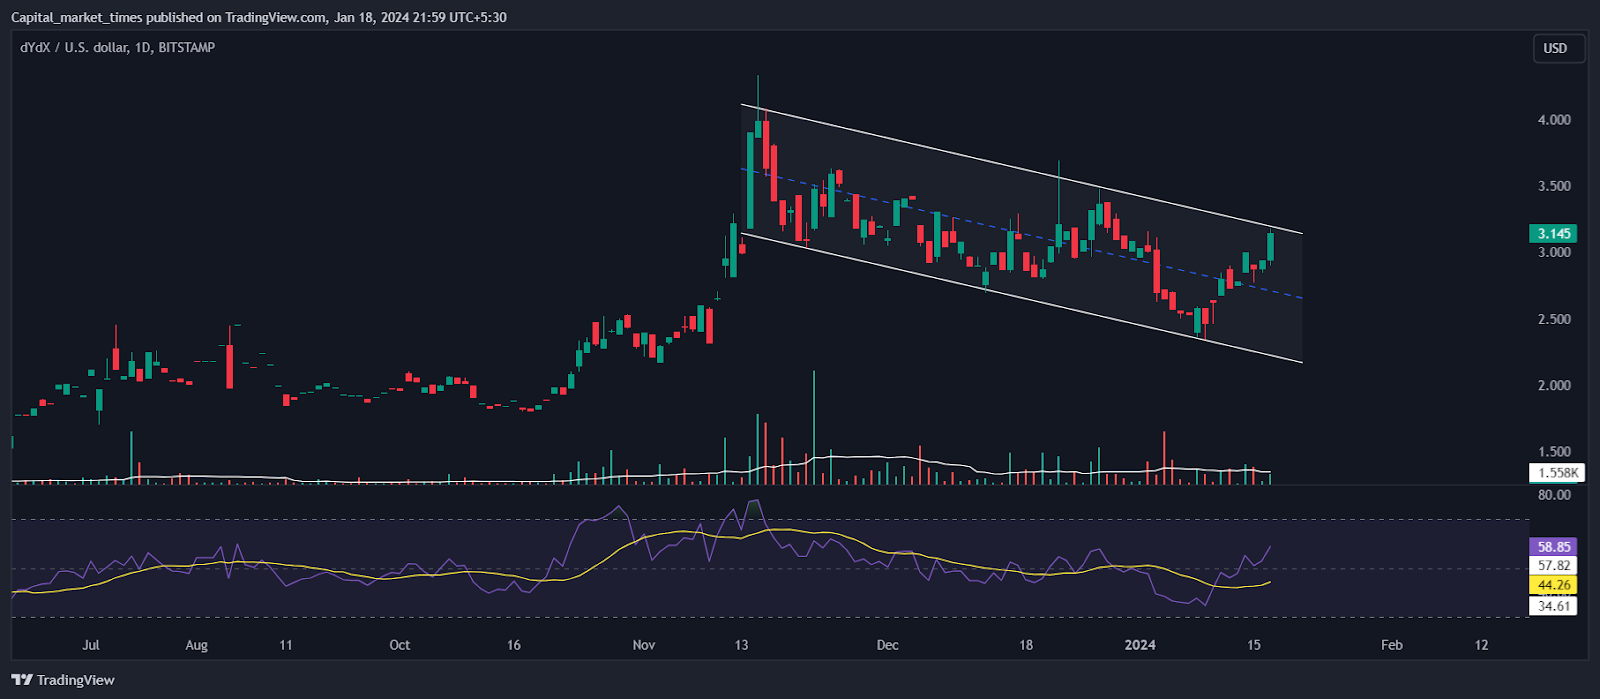
Source: Tradingview
At the time of writing DYDX price is trading at the level of $3.08 with an intraday rise of 7.08% and the 24-hour volume is increased by almost 60% as per the data of trading view. The current market cap of the crypto is 972.449 Million.
As per the data of trading view, The performance of the DYDX price is also good throughout the year as it surged by 124.48% last year and gained approx 47% in the last 6 months. Moreover, it has gained 66.76% in the last 3 months, and resuming its bullishness it gained 17.39% this week.
As per the trading view technical summary out of 26 indicators 10 are on the neutral side, 16 are on the buy side, and zero are on the sell side which means a strong buy signal.
The technical indicator RSI is supporting the bullish momentum and hovering at the level of 58.85 above the 14-day SMA line.
Additionally, the Dydx price also breaks above the key moving averages showcasing bullishness on the daily chart. Now if the price breaks the descending pattern and rises above the $4 level it will be confirmed the bullish momentum in the price and if the price did not sustain at the current level it may see further downside.
Disclaimer
The information contained in this article is intended for informational and educational purposes only. It should not be construed as financial, investment, or trading advice. Investing and trading involve risk, and you should carefully consider your own circumstances and risk tolerance before making any investment decisions.