HOLO Stock Price Forecast: MicroCloud Hologram Stock Surge 200%?

HOLO stock price surging high become every penny stock trader and investor’s favourite. As per the data of the trading view the stock gave an unexpected return of 200% this week.
MicroCloud Hologram (NASDAQ: HOLO) stock price surge took its market cap close to 394.26 Million. The stock is now considered the best performer on Wall Street in 2024.
The recent surge in HOLO stock appears to be driven by retail traders, as there is no significant news catalyst behind it. Chinese companies and penny stocks are experiencing high trading volumes, contributing to the bullish trend.
However, caution is warranted. Despite the stock’s rally, the company’s fundamentals are not robust. The latest financial results, published in June, reveal that MicroCloud Hologram Inc. reported lower revenue of $6.9 million compared to $10.9 million in the same quarter last year. Additionally, the net loss increased from $0.5 million to $2.1 million year-on-year.
MicroCloud Hologram Inc. operates as a holographic digitalization technology service provider in China, offering solutions and services worldwide. As of now, HOLO stock is trading at $66.36, with an impressive intraday surge of 114.06% and a trading volume of 12.72 million shares.
Indeed, the recent rally in MicroCloud Hologram stock remains shrouded in mystery, as no significant news directly related to the company has surfaced. Investors treading this path should exercise caution, recognizing the possibility that certain individuals may be manipulating the stock price for their personal benefit. Vigilance and prudent decision-making are essential in such speculative scenarios.
HOLO Stock Price on the Technical Chart
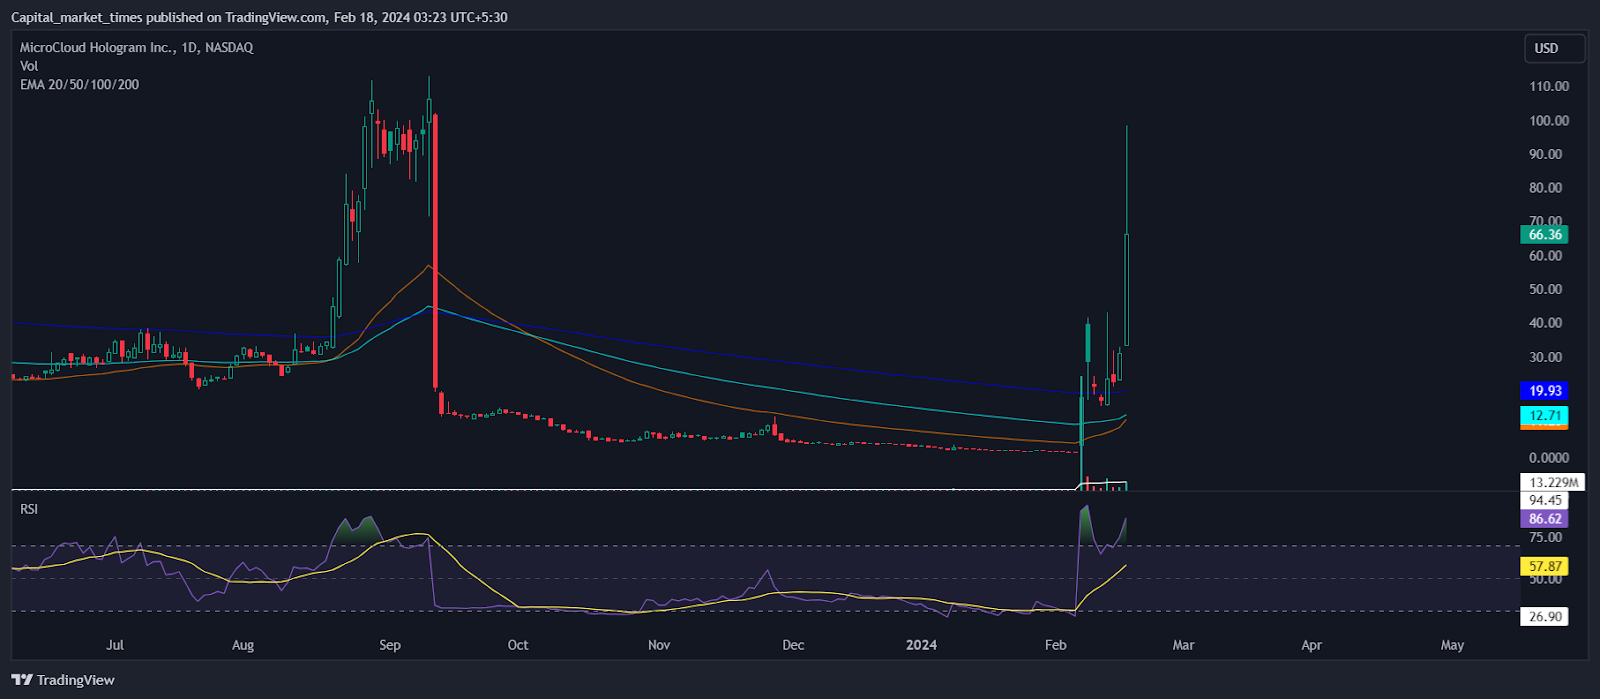
Source: Tradingview
The recent performance of this stock has been remarkable, with an outstanding 2785.22% return in just one month and a 201.64% return over the past week, according to TradingView data.
While the TradingView technicals indicate a strong buy, it’s essential to exercise caution during such rapid price rallies. Technical indicators may not always function optimally under these circumstances.
Here are some key observations from the technical analysis:
- Moving Averages (MA): The price is currently trading above the key moving averages, including the 20-day, 50-day, 100-day, and 200-day Exponential Moving Averages (EMA). This alignment suggests bullish sentiment on the daily technical chart.
- Relative Strength Index (RSI): The RSI curve stands at 86.62, positioned above the 14-day Simple Moving Average (SMA) curve. This placement indicates that the price is in bullish territory.
- Moving Average Convergence Divergence (MACD): The MACD is also signalling bullish momentum, hovering in the positive zone.
Overall the technical indicators collectively paint a positive picture for the stock price. However, prudent risk management remains crucial, especially during volatile market conditions.
Investors should be wary of the fear of missing out (FOMO). While scarcity tactics are used in the crypto market to attract more investors, it’s essential to maintain a prudent distance. Market volatility remains an emerging concern.
Disclaimer
It’s important to note that the views and opinions presented in this article are for informational purposes only and do not constitute financial, investment, or other advice. Investing in or trading stocks carries inherent risks, and readers should conduct their research before making any financial decisions.