Moonbeam Crypto Forecast: GLMR Price Drop By 6%; What Next?

The moonbeam crypto price is halted near the value of $0.669 and heading downward. However, despite the recent weakness the crypto didn’t break the dynamic support levels and took a reversal from it.
Moreover, the GLMR price broke the 20 EMA took support on the 50 EMA level, and bounced back from there. However, bears are also trying hard to down the price below the $0.378 level.
At the time of writing the Moonbeam crypto price is trading at the level of $0.4125 with a massive drop of 6.70% and the volume has also declined by almost 46.96% showing bear dominance in the recent trading session.
As per the Coinmarketcap, the 24-hour trading volume is 12.386 Million with a current market cap of 339.311 Million. Additionally, the circulating supply of the coin is 821.577 Million and the fully diluted market cap is 454.789 Million.
The coin’s performance has been volatile throughout the year as the Moonbeam crypto price declined by 7.81% year to date and gained by 69.96% in the previous six months. The price surged by 123.24% in the last 3 months and 21.47% in the last month. However, after a remarkable performance in previous months, the price is now in a corrective phase as it declined by 8.83% last week.
Price Overview of the Moonbeam Crypto
As per the data of Coingecko, the highest price touched by Moonbeam was $19.50 on Jan 11 2022 about 2 years ago. However, the price is a 97.91% decline from the highest level. Moreover, the lowest price touched by the GLMR crypto was $0.1605 about 4 months ago. Currently, the price is up by 153.99% compared to the all-time low price.
Technical Analysis of the Moonbeam Crypto Price
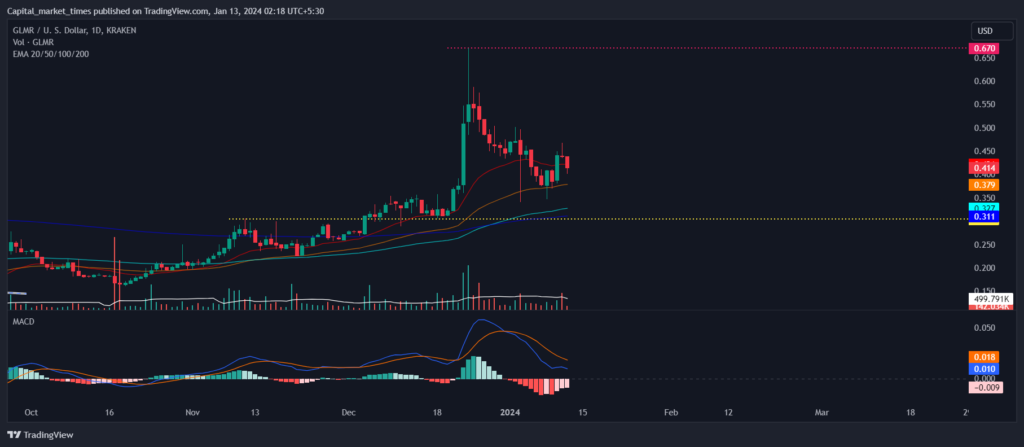
Source: Tradingview
On the technical charts, the GLMR crypto price is in the correction phase trading below the 20 moving average. The RSI curve is trading in the middle range at 50.04 showcasing neutrality in the price. MACD curve is heading downward and a bearish cross in MACD shows weakness.
Overall the price cation and the technical indicators are showcasing bearishness in the GLMR crypto price. However, if the price is sustained at the current levels it might bounce back to higher levels.
Technical levels
Supports Levels: $0.378 and $0.327.
Resistance Levels: $0.498 and $0.586.
Disclaimer
The information contained in this article is intended for informational and educational purposes only. It should not be construed as financial, investment, or trading advice. Investing and trading involve risk, and you should carefully consider your own circumstances and risk tolerance before making any investment decisions.