OP Stock Forecast: Will OceanPal Stock Smash $5 Mark?

Based on the technical chart, the OP Stock price has witnessed strong selling pressure, leading to an all-time low. The chart structure has displayed a directional momentum and sellers have been dominating. The price has formed a base near the $1.50 hurdle and showed buyers’ interest.
Since September 2023, the OceanPal stock price has displayed buying momentum. Currently, the price faces resistance from the $3 mark for more than 6 months. Buyers are struggling to dominate the $3 mark for a prolonged time and recently, it has faced resistance and falling to the trendline.
RSI is 36 which has slowly declined from the overbought zone to the oversold zone indicating the sellers’ grip. OP stock price is trading far below the 200-day EMA and has recently dropped below the 20-day EMA, showing the sellers’ dominance.
About OceanPal Inc.(OP)
Globally, OceanPal Inc. is a key player in maritime cargo transport. With a specialized fleet of dry bulk carriers, the company is pivotal in moving both major commodities like iron ore, coal, and various grains, as well as the less conspicuous yet crucial minor bulks such as bauxite, phosphate, and fertilizers. By the close of 2023, OceanPal’s naval contingent comprised five substantial vessels, including three Panamaxes and two Capesizes, collectively boasting a hefty carrying potential of around 572,599 deadweight tons.
Established in the historic cradle of civilization, Athens, Greece, in 2021, OceanPal Inc. stands as a modern-day mariner, bridging continents and cultures through its indispensable transportation services.
OP Stock Price Has Formed an Ascending Triangle Pattern?
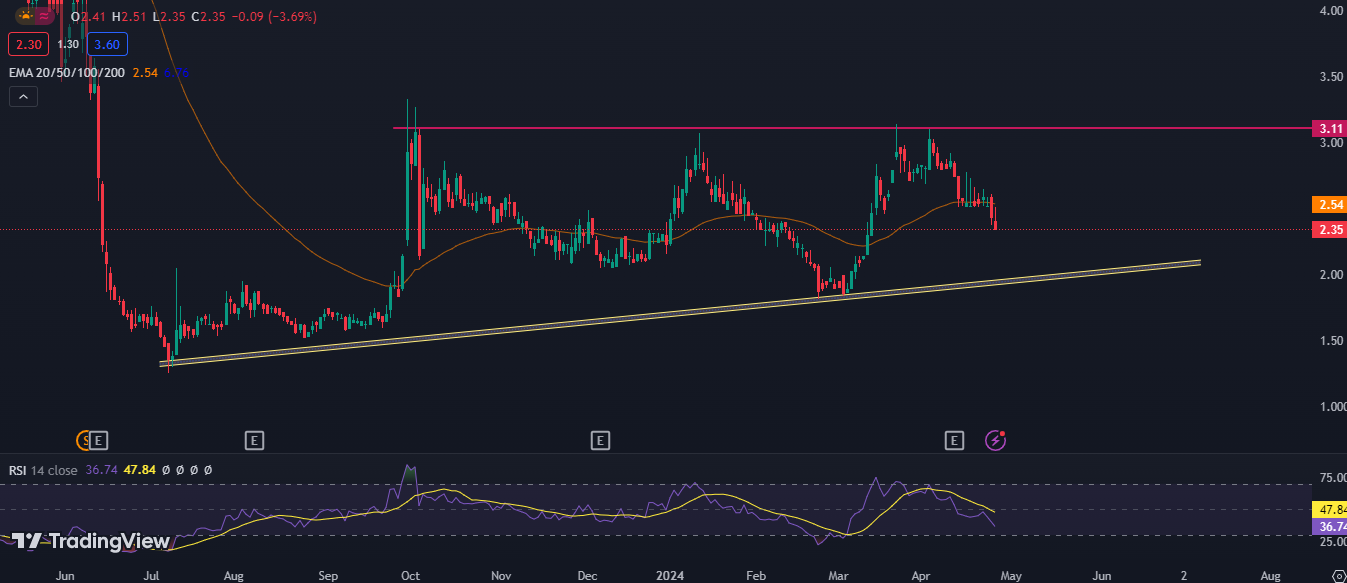
NASDAQ: OP/USD 1-Day Chart By TradingView
OP stock price has been rising by taking support on the trendline and facing resistance from the $3 hurdle. The price has formed an exhaustion and impulsion pattern on a daily time frame and has dropped below the 20-day EMA.
Suppose the sellers show interest then OceanPal stock price may fall back to the trendline. If the price bounces back and triggers a breakout from the ascending triangle and sustains then the price may gain bullish momentum. Suppose the buying momentum is supported by the trading volume, trend reversal can be expected.
on the other hand, if the OceanPal stock price slips below the trendline then strong selling momentum can be seen. If the price starts trading below the trendline, it will be difficult for the buyers to bounce back.
Technical Analysis of OP Stock Price Over Weekly Timeframe
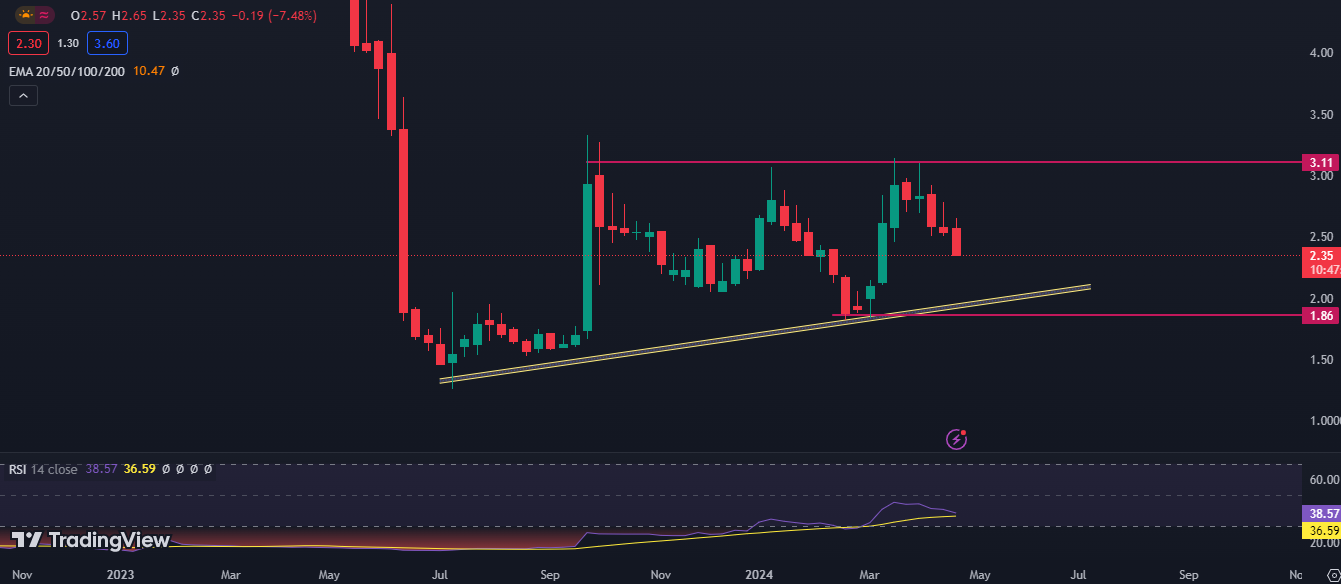
NASDAQ: OP/USD 1-Week Chart By TradingView
OP price is trading at $2.35 which has lost 3.69% in the last intraday session. The market capitalization is $17.51 million and the public float is 1.66 million. The average trading volume is $26.14K and the EPS is $2.
Based on the technical chart, the OP stock price is rising by defending the last swing lows which showcases buyers’ involvement. According to the technical chart analysis, the asset price may take a reversal and go for a higher high.
If the price fails to defend the last swing low, sellers may become confident and selling pressure can be expected. Alternatively, if the surpasses the recent higher high with increases in trading volume, buyers may lead the trend.
Conclusion
OceanPal (OP) stock has experienced significant market fluctuations, with its stock price reaching an all-time low. Recent technical indicators suggest a potential shift in momentum, with growing buyer interest and a possible short-term rebound. The stock’s resistance at the $3 level has been a consistent challenge, but the ascending triangle pattern forming on the chart could signal a breakout. Investors should monitor these technical signals closely, as they may dictate the future direction of OP stock.
Disclaimer
It’s important to note that the views and opinions presented in this article are for informational purposes only and do not constitute financial, investment, or other advice. Investing in or trading stocks carries inherent risks, and readers should conduct their research before making any financial decisions.